USNCO Part III Lab Practical Analysis
2015 – 2025 | Quantitative & Qualitative Summary
Lab Practicals
Question: Determine the concentration (in mass %) of a hydrogen peroxide solution using catalytic decomposition.
What happens when MnO₂ is added to H₂O₂? Write the balanced equation.
Key Chemistry: 2H2O2 → 2H2O + O2 (catalyzed by MnO2)
Equipment
- 250 mL Erlenmeyer flasks (3)
- Watch glasses (3) to cover flask mouths
- Spatula, Beral pipets (2)
- Electronic balance (±0.01 g, capacity ≥250 g)
Chemicals
- 100 mL hydrogen peroxide solution (6 mass %, labeled only "Hydrogen Peroxide Solution")
- 1 g MnO2 catalyst in a vial
Given the equipment and chemicals, how would you design this experiment?
Method
- Weigh flask + watch glass empty
- Add measured H2O2 solution to flask; weigh again
- Add small amount of MnO2; cover with watch glass to prevent splashing
- Wait for complete decomposition (no more bubbling)
- Weigh final assembly — mass loss = mass of O2 evolved
- Calculate mass % H2O2 from stoichiometry
- Replicate trials
What measurements would you record? Design your data table first.
| Parameter | Trial 1 | Trial 2 | Trial 3 |
|---|---|---|---|
| Mass flask + watch glass (g) | — | — | — |
| Mass flask + solution (g) | — | — | — |
| Mass H2O2 solution (g) | — | — | — |
| Mass after decomposition (g) | — | — | — |
| Mass O2 lost (g) | — | — | — |
| Calculated mass % H2O2 | — | — | — |
Actual value: 6 mass %. From mass of O2 lost, calculate moles O2, then moles H2O2 (2:1 ratio), then mass H2O2 / mass solution × 100.
What would you expect to observe during this experiment?
- Vigorous bubbling upon adding MnO2 — exothermic reaction
- Flask may become warm/hot — use watch glass to prevent loss
- MnO2 is a black powder that acts as catalyst (not consumed)
- Decomposition can take several minutes to complete
- Ensure all bubbling has stopped before final weighing
- Small amounts of water vapor may also escape — source of error
What do you think the graders are looking for? How would you score this?
Point Breakdown (25 pts total)
Expected answer: ~6 mass %. Students also asked to list sources of error and indicate directional effect on result.
Common Pitfalls
- Not waiting for complete decomposition before final weighing
- Forgetting to cover flask with watch glass — water vapor escapes, inflating mass loss
- Using too much MnO₂ causes vigorous reaction and splashing/loss
- Not doing replicate trials (minimum 2–3 for full credit)
Question: Determine the sign of ΔH for the [Cu(H2O)4]2+ ⇌ [CuCl4]2− equilibrium, and identify Solution A and Solution B as KCl or AgNO3.
How does temperature shift the Cu²⁺ aqua/chloro equilibrium? What does that tell you about ΔH?
Key Chemistry: Blue [Cu(H2O)4]2+ ⇌ Green/Yellow [CuCl4]2− (color change indicates equilibrium shift)
Equipment
- 50 mL beakers (3)
- Stirring rod, spatula
- 10 mL graduated cylinder
- Beaker tongs
- Access to hot plate (shared) and ice bath (shared)
Chemicals
- NaCl (5 g solid)
- 0.3 M Cu(NO3)2 solution (50 mL)
- Solution A: 0.1 M AgNO3 (3 mL in Beral pipet)
- Solution B: 2 M KCl (3 mL in Beral pipet)
Given the equipment and chemicals, how would you design this experiment?
Method
- Prepare equilibrium mixture: dissolve NaCl in Cu(NO3)2 until color changes from blue to green
- Split into 3 portions
- Heat one portion, cool another — observe color changes to determine sign of ΔH
- Add Solution A to one portion, Solution B to another — observe shifts
- Identify A and B based on equilibrium shift direction
What measurements would you record? Design your data table first.
| Condition | Color Change | Equilibrium Shift |
|---|---|---|
| Heating | More green/yellow | Forward (endothermic) |
| Cooling (ice bath) | More blue | Reverse (exothermic favored) |
| Add Solution A (AgNO3) | More blue | Reverse (Ag+ removes Cl−) |
| Add Solution B (KCl) | More green | Forward (adds Cl−) |
What would you expect to observe during this experiment?
- Heating: Solution shifts toward green/yellow → forward reaction is endothermic → ΔH is positive
- Cooling: Solution shifts toward blue → reverse reaction favored at low T
- Solution A (AgNO3): Ag+ precipitates Cl− as AgCl → removes Cl− → shifts left → more blue
- Solution B (KCl): Adds Cl− → shifts right → more green/yellow
- Students should identify: [Cu(H2O)4]2+ = blue, [CuCl4]2− = green/yellow
What do you think the graders are looking for? How would you score this?
Point Breakdown (25 pts total)
Must correctly identify species colors, sign of ΔH (positive), and both Solution A (AgNO3) and Solution B (KCl).
Common Pitfalls
- Confusing color direction: blue = [Cu(H₂O)₄]²⁺, green/yellow = [CuCl₄]²⁻
- Not establishing a clear baseline color before adding reagents
- Only testing heating OR cooling — must do both to confirm ΔH sign
- Not connecting Ag⁺ removing Cl⁻ to the equilibrium shift
Question: Determine the kinetic order with respect to [Fe3+] and [I−] using the Fe³⁺/I⁻/S₂O₃²⁻/starch system.
What is the rate law for 2Fe³⁺ + 2I⁻ → products? How does the starch-thiosulfate endpoint work?
Key Chemistry: 2Fe3+ + 2I− → 2Fe2+ + I2; thiosulfate scavenges I2 until depleted, then starch turns blue-black
Equipment
- 10 mL graduated cylinders (2)
- Disposable transfer pipettes (6)
- 50 or 100 mL beakers (2)
- Stopwatch or timer
Chemicals
- Solution A: 0.035 M Fe(NO3)3 in 0.3 M HNO3 (100 mL)
- Solution B: 0.060 M KI (100 mL)
- Solution C: dilute Na2S2O3 + starch indicator (100 mL)
- Distilled water (500 mL)
Lab Setup
Given the equipment and chemicals, how would you design this experiment?
Method
- Mix Solutions B and C in a beaker
- Add Solution A and start timing
- Record time until distinct, permanent blue-black color appears
- Vary volumes of A (keeping B constant) to determine order w.r.t. [Fe3+]
- Vary volumes of B (keeping A constant) to determine order w.r.t. [I−]
- Use method of initial rates: compare rate ratios with concentration ratios
What measurements would you record? Design your data table first.
| Trial | Vol A (mL) | Vol B (mL) | Vol C (mL) | Vol H2O (mL) | Time (s) | Rate (1/t) |
|---|---|---|---|---|---|---|
| 1 | 5 | 5 | 5 | 0 | — | — |
| 2 | 10 | 5 | 5 | 0 | — | — |
| 3 | 5 | 10 | 5 | 0 | — | — |
Students should keep total volume constant (use water to dilute) and calculate effective concentrations. Expected: first order in [Fe3+], second order in [I−].
What would you expect to observe during this experiment?
- Solution changes from colorless/pale yellow to sudden blue-black endpoint
- Thiosulfate scavenges I2 as it forms — reaction appears to have no change until S2O32− is consumed
- Starch-iodine complex produces the distinctive dark blue-black color
- Doubling [Fe3+] should approximately halve the time (first order)
- Doubling [I−] should approximately quarter the time (second order: 2² = 4× faster)
- Temperature significantly affects rate — keep consistent
What do you think the graders are looking for? How would you score this?
Point Breakdown (25 pts total)
Expected: Order w.r.t. [Fe3+] = 1, order w.r.t. [I−] = 2. Must also write rate expression: Rate = k[Fe3+][I−]²[S2O32−]x.
Common Pitfalls
- Not keeping total volume constant across trials — must add water to compensate
- Temperature variation between trials invalidates rate comparisons
- Timing imprecision — the blue-black endpoint must be recorded to the second
- Confusing the rate (1/t) calculation with the concentration change
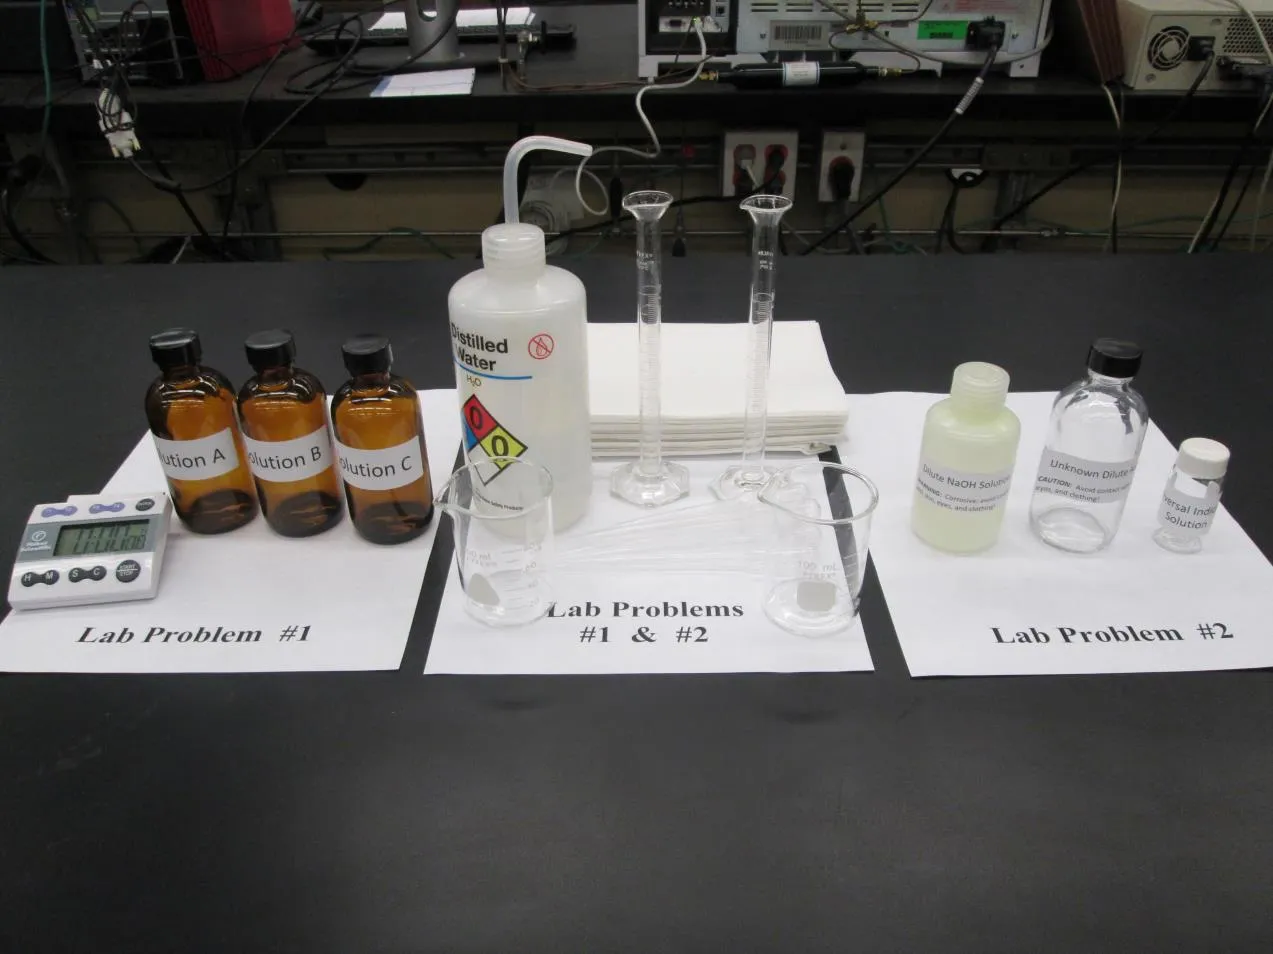
Question: Determine whether an unknown dilute acid is monoprotic, diprotic, or triprotic.
How many equivalence points would a monoprotic, diprotic, and triprotic acid each show?
Unknown: Phosphoric acid (H3PO4) — triprotic
Equipment
- 10 mL graduated cylinders (2), transfer pipettes (6)
- 50 or 100 mL beakers (2)
- Distilled water wash bottle
Chemicals
- 50 mL unknown dilute acid (phosphoric acid, ~0.5 N)
- 50 mL dilute NaOH solution (0.5 N)
- Universal indicator solution (10 mL) with color chart
Given the equipment and chemicals, how would you design this experiment?
Method
- Measure fixed volume of unknown acid
- Add universal indicator
- Titrate with NaOH dropwise, recording color changes
- Count drops/volume to each equivalence point (color plateau change)
- Number of distinct equivalence points = number of acidic protons
- Alternative: prepare multiple aliquots with increasing ratios of NaOH to acid
What measurements would you record? Design your data table first.
| Vol NaOH added (drops) | pH (est. from indicator) | Color |
|---|---|---|
| 0 | ~2 | Red |
| First equivalence | ~4–5 | Orange-Yellow |
| Second equivalence | ~7 | Yellow-Green |
| Third equivalence | ~10 | Blue-Violet |
Three distinct color transitions indicate triprotic acid. Volume ratios between equivalence points should be approximately 1:1:1.
What would you expect to observe during this experiment?
- Universal indicator changes through full color spectrum: red → orange → yellow → green → blue → violet
- Three distinct color transition regions visible as NaOH is added
- The third equivalence point may require significantly more NaOH (pKa3 = 12.4 for H3PO4)
- Students should look for pH "plateaus" followed by rapid changes
- Color chart provided with indicator is essential for pH estimation
What do you think the graders are looking for? How would you score this?
Point Breakdown (25 pts total)
Correct answer: triprotic. Must provide supporting data (volume ratios, color changes, graph/illustration) to justify conclusion.
Common Pitfalls
- Being too sloppy with NaOH additions to detect the 3rd equivalence point
- Not using small enough increments near color transitions
- Not recording both volume AND color at each step
- Forgetting that volume ratios between equivalence points should be ~1:1:1
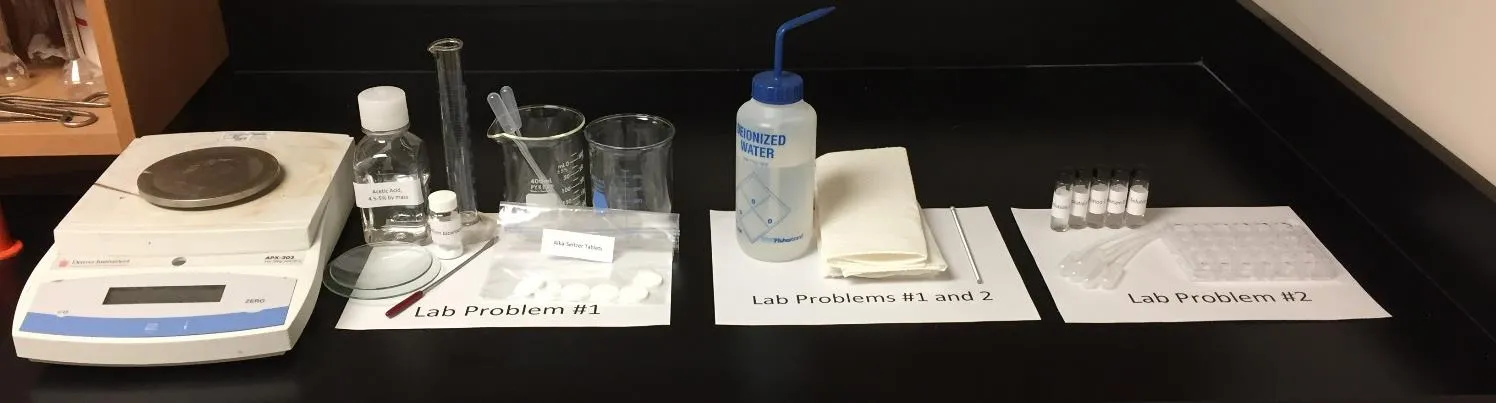
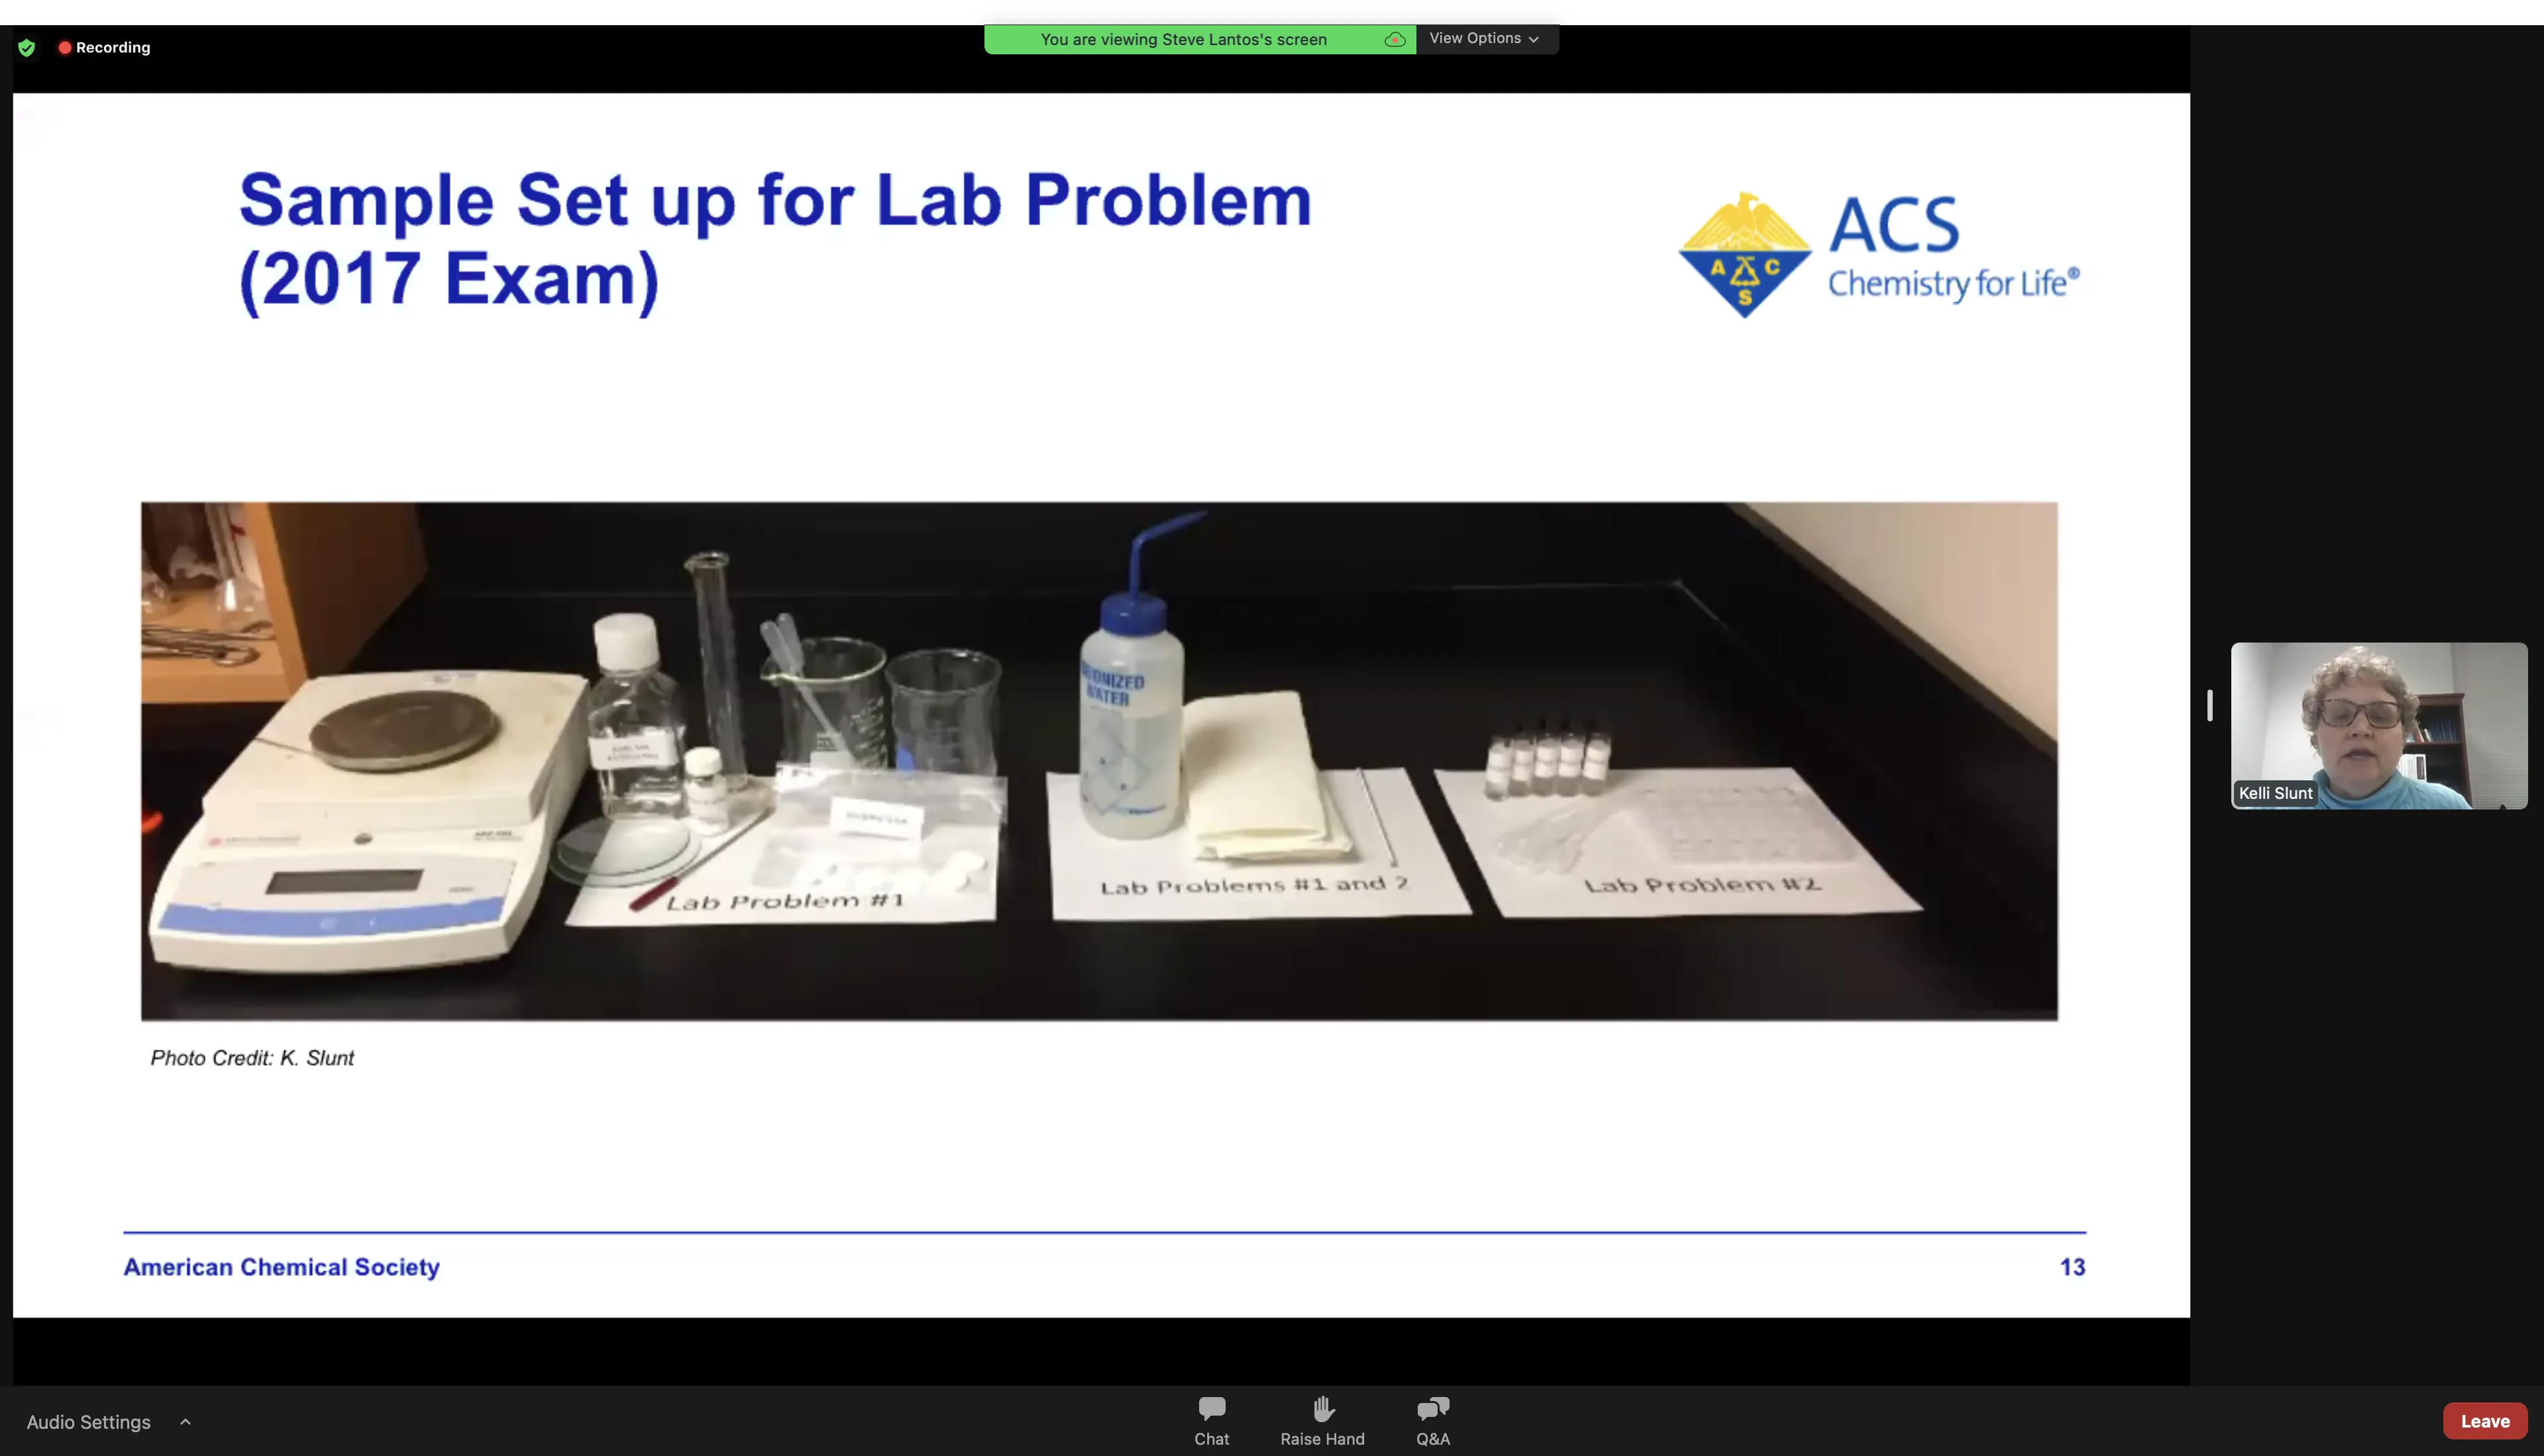
Question: Determine the mass percent of sodium bicarbonate and citric acid in an Alka-Seltzer tablet.
Why do you need BOTH a water trial AND a vinegar trial? What does each tell you?
Key Chemistry: H3A + 3NaHCO3 → Na3A + 3CO2 + 3H2O (citric acid is limiting in water alone)
Equipment
- Balance (±0.01 g)
- 50 mL graduated cylinder
- 250 or 400 mL beakers (2), watch glasses (2)
- Spatula, Beral pipets (2), stirring rod
Chemicals
- Alka-Seltzer tablets (6, original formula)
- 4.5–5% acetic acid (vinegar, 150 mL)
- Sodium bicarbonate (3 g, for testing)
Lab Setup
Given the equipment and chemicals, how would you design this experiment?
Method
- Weigh beaker + watch glass + tablet
- Water trial: Dissolve tablet in water → citric acid is limiting → CO2 mass loss = from citric acid only
- Vinegar trial: Dissolve tablet in excess vinegar → all NaHCO3 reacts → CO2 mass loss = from all bicarbonate
- Wait until no more bubbling; record final mass
- Calculate mass % of NaHCO3 and citric acid from stoichiometry
What measurements would you record? Design your data table first.
| Exp | Water (mL) | Acid (mL) | Mass tablet (g) | Mass CO2 (g) | Mass NaHCO3 reacted (g) | Mass % |
|---|---|---|---|---|---|---|
| 1 (water) | 35 | 0 | 3.227 | 0.603 | 1.151 | 35.7 |
| 6 (vinegar) | 10 | 25 | 3.254 | 0.999 | 1.909 | 58.6 |
Actual composition: NaHCO3 = 59.1%, citric acid = 30.9%, aspirin = 325 mg remainder. Water-only trial gives citric acid mass %.
What would you expect to observe during this experiment?
- Vigorous fizzing/bubbling when tablet dissolves (CO2 evolution)
- Small amount of solid may remain (aspirin is insoluble in water)
- With water alone: fizzing stops when citric acid is consumed (limiting reagent)
- With excess vinegar: more vigorous and prolonged fizzing — all NaHCO3 reacts
- Must wait until all visible gas evolution ceases before final weighing
- Stirring helps release dissolved CO2
What do you think the graders are looking for? How would you score this?
Point Breakdown (25 pts total)
Expected Answers
| Component | Actual Mass % |
|---|---|
| Sodium bicarbonate | 59.1% |
| Citric acid | 30.9% |
Common Pitfalls
- Only doing one solvent — need water (citric acid limiting) AND vinegar (all NaHCO₃ reacts)
- Not stirring to release dissolved CO₂ before final weighing
- Forgetting the limiting reagent concept: in water, citric acid limits; in excess acid, NaHCO₃ limits
- Aspirin residue (insoluble) confusing mass measurements
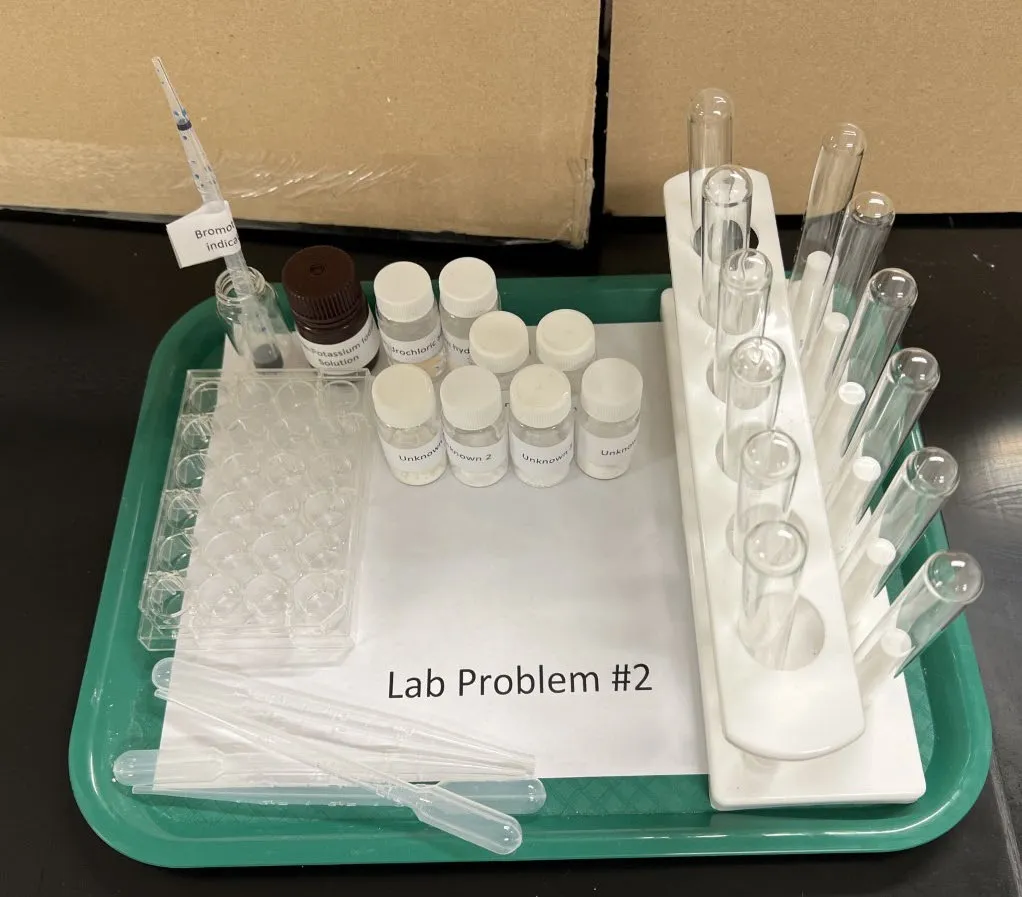
Question: Identify 5 unknown 0.5 M solutions (A–E) by mixing them pairwise and observing reactions.
Which pairs of CaCl₂, Na₂CO₃, NaCl, NaOH, H₂SO₄ produce precipitates or gas?
Unknowns: CaCl2, Na2CO3, NaCl, NaOH, H2SO4
Equipment
- Beral-style pipets (5)
- 24-well plate
- Stirring rod
Chemicals
- 5 vials (A–E), each 5 mL of 0.5 M solutions
- CaCl2, Na2CO3, NaCl, NaOH, H2SO4
Given the equipment and chemicals, how would you design this experiment?
Method
- Mix each pair systematically in well plate
- Record all observations: precipitate, gas, heat, no change
- Use a 5×5 grid matrix (10 unique combinations)
- Identify based on reaction patterns
What measurements would you record? Design your data table first.
| CaCl2 | Na2CO3 | H2SO4 | NaOH | |
|---|---|---|---|---|
| NaCl | No change | No change | No change | No change |
| CaCl2 | — | White ppt (thick) | No change | White ppt (fine/cloudy) |
| Na2CO3 | — | Gas evolved (fizzes) | No change | |
| H2SO4 | — | No visible change (heat) |
What would you expect to observe during this experiment?
Key Distinguishing Observations
- NaCl: No reaction with any other solution — the "inert" one
- Na2CO3 + H2SO4: Gas evolution (CO2 fizzing) — unique identifier
- CaCl2 + Na2CO3: Thick white precipitate (CaCO3)
- CaCl2 + NaOH: Fine white precipitate/cloudy (Ca(OH)2)
- H2SO4 + NaOH: Neutralization — heat but no visible change without indicator
- Key ionic equations: Ca2+ + CO32− → CaCO3(s); CO32− + 2H+ → CO2(g) + H2O
What do you think the graders are looking for? How would you score this?
Point Breakdown (25 pts total)
1 pt each for correct identification (5 pts). 9 pts for appropriate net ionic equations used in identification.
Common Pitfalls
- Not testing ALL 10 unique pairs systematically
- Cross-contaminating solutions with pipets
- Not distinguishing "no visible reaction" from "both solutions are clear" in the grid
- Forgetting to write net ionic equations for observed reactions
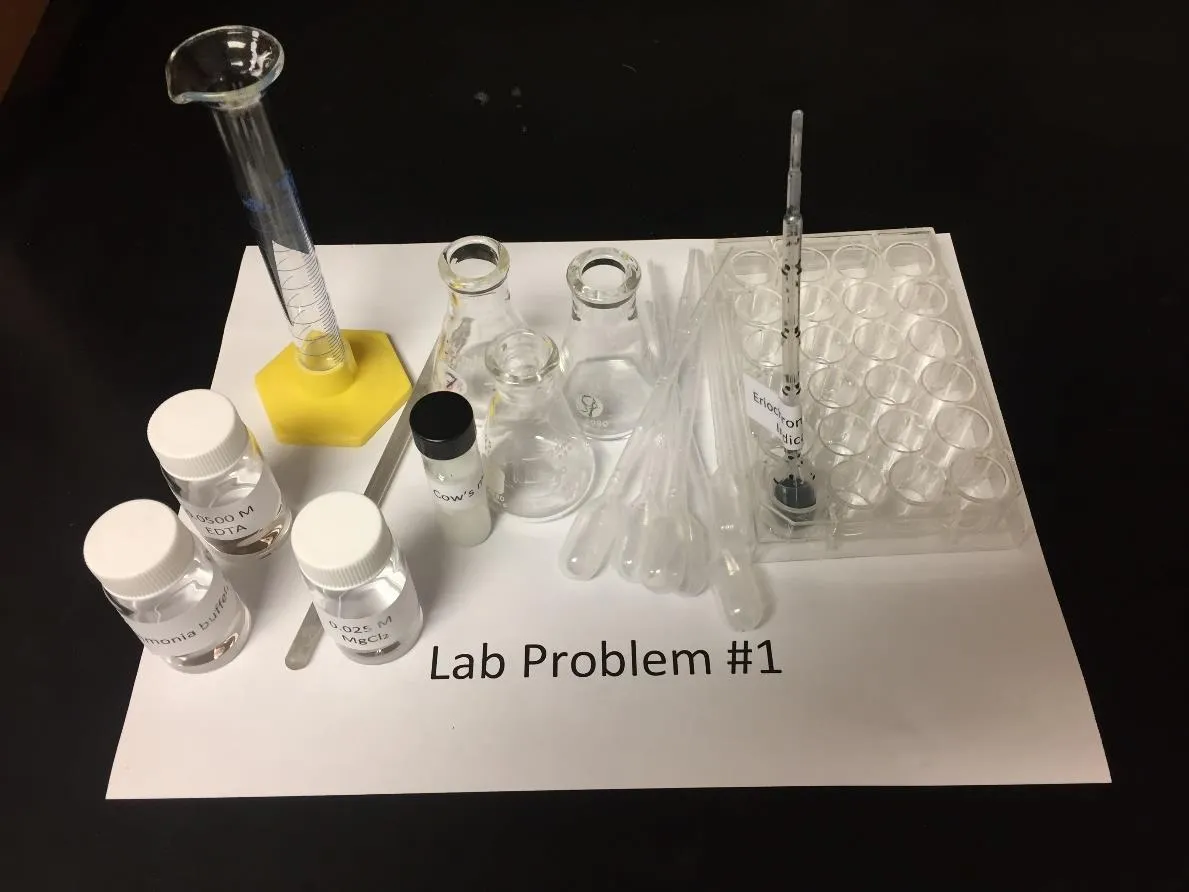
Question: Determine the total combined concentration (mol/L) of calcium and magnesium in skim milk.
How does EDTA bind metal ions? What role does Eriochrome Black T play at pH 10?
Key Chemistry: EDTA forms 1:1 complexes with Ca2+ and Mg2+ at pH 10; Eriochrome Black T indicator: red (metal-bound) → blue/black (free)
Equipment
- 10 mL graduated cylinder
- 25 or 50 mL Erlenmeyer flasks/beakers (3)
- Stirring rod, well plate (12 or 24 wells)
- Graduated Beral pipets (6, with 0.25 mL graduations)
Chemicals
- 0.0500 M EDTA solution (10 mL)
- Ammonia buffer (pH ~10, 10 mL)
- 0.025 M MgCl2 solution (10 mL, for practice)
- Eriochrome Black T indicator (1 mL in Beral pipet)
- Skim milk (0% fat, 5 mL)
Lab Setup
Given the equipment and chemicals, how would you design this experiment?
Method
- Practice: titrate MgCl2 + buffer + indicator with EDTA to learn endpoint
- Mix measured volume of milk + buffer + indicator (turns red/wine color)
- Titrate with EDTA drop by drop until color changes from red to blue/black
- Record volume of EDTA; calculate moles of divalent cations
- Alternative: add excess EDTA to milk, back-titrate with MgCl2
- Replicate trials
What measurements would you record? Design your data table first.
| Parameter | Trial 1 | Trial 2 | Average |
|---|---|---|---|
| Volume milk (mL) | — | — | — |
| Volume buffer (mL) | — | — | — |
| Drops indicator | — | — | — |
| Volume EDTA to endpoint (mL) | — | — | — |
| Color at endpoint | Red → Blue | Red → Blue | — |
| Total [Ca2++Mg2+] (mol/L) | — | — | — |
USDA values: Ca 122–143 mg/100g, Mg 11–16 mg/100g in skim milk. Expected total: 0.036–0.044 mol/L.
What would you expect to observe during this experiment?
- Milk + buffer + indicator → wine red / pink-red color
- As EDTA is added: red color gradually fades
- Endpoint: color changes from red/pink to blue/black (all metal ions complexed)
- Milk opacity makes endpoint harder to read — use strong light
- MgCl2 practice run helps students learn to recognize the endpoint
- Drop calibration essential — count drops and convert to volume
What do you think the graders are looking for? How would you score this?
Point Breakdown (25 pts total)
Accuracy Tiers
| Range | Points |
|---|---|
| 0.030 – 0.045 M | Full credit (5/5) |
| 0.020 – 0.030 or 0.045 – 0.060 M | 3/5 |
| 0.015 – 0.020 or 0.060 – 0.070 M | 2/5 |
Common Pitfalls
- Not buffering to pH 10 — the indicator won't work at lower pH
- Overshooting the endpoint: red → blue transition can be subtle
- Not calibrating Beral pipet drop volume before starting
- Forgetting that EDTA chelates BOTH Ca²⁺ and Mg²⁺ (total hardness)
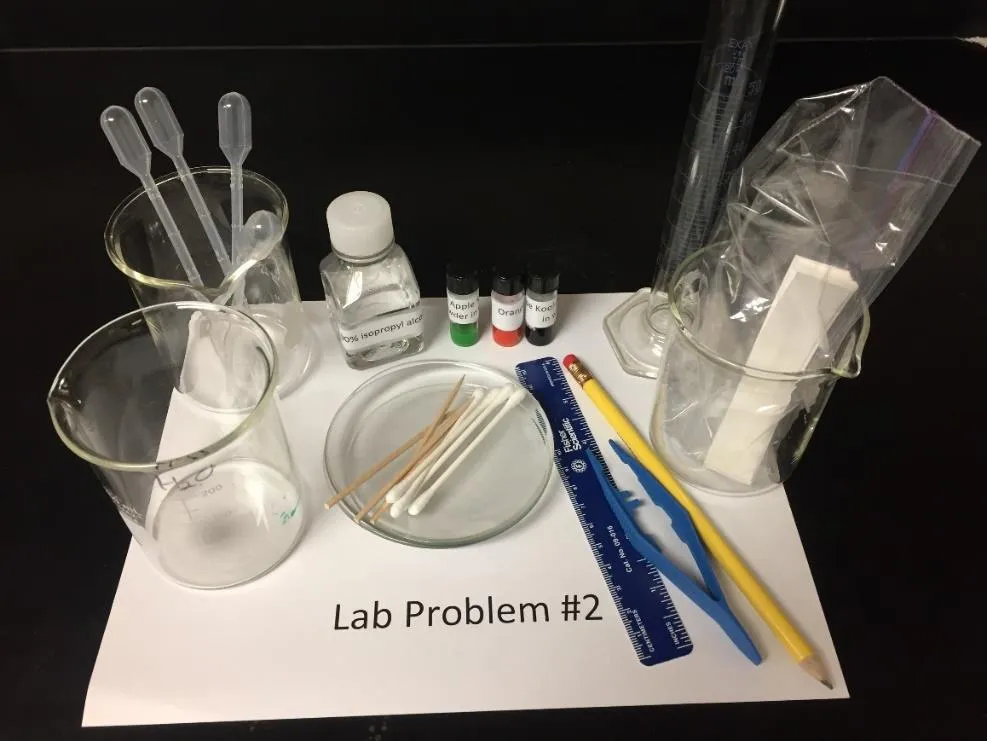
Question: Separate dyes in two Kool-Aid samples using paper chromatography and rank the dyes by polarity.
Which FD&C dyes are in common Kool-Aid flavors? How does Rᶠ relate to polarity?
Dyes: Red 40, Yellow 5, Blue 1 (varies by flavor: Green Apple = Yellow 5 + Blue 1; Grape = Red 40 + Blue 1; Orange = Red 40 + Yellow 5)
Equipment
- Whatman 3MM chromatography paper strips (12, 2×10 cm)
- 250 mL beakers (3) with watch glass covers
- Cotton swabs (4), toothpicks (4)
- Ruler, pencil, tweezers
- 25 or 50 mL graduated cylinder
Chemicals
- Two Kool-Aid samples dissolved in water (0.4 g/mL, 1 mL each)
- 90% isopropyl alcohol (50 mL)
- Distilled water
Lab Setup
Given the equipment and chemicals, how would you design this experiment?
Method
- Draw pencil line ~1 cm from bottom of paper strip
- Spot Kool-Aid solution on line using cotton swab; let dry
- Place strip in beaker with eluent (water, isopropanol, or mixtures) below the spot
- Cover with watch glass; allow solvent to rise
- Remove when solvent front near top; mark solvent front
- Measure Rf values for each dye spot
- Try multiple eluents for best separation
What measurements would you record? Design your data table first.
| Dye | Color | Rf (water) | Rf (isopropanol) | Polarity Rank |
|---|---|---|---|---|
| Blue 1 | Blue | Highest | Lowest | Least polar |
| Yellow 5 | Yellow | Medium | Medium | Medium |
| Red 40 | Red | Lowest | Medium | Most polar (water eluent) |
Polarity order depends on eluent. Water eluent: Blue (least polar) < Yellow < Red (most polar). Isopropanol eluent: Blue < Red < Yellow.
What would you expect to observe during this experiment?
- Each Kool-Aid flavor produces 2 distinct color spots on chromatography paper
- With water eluent: more polar dyes travel farther (higher Rf)
- With isopropanol: less polar dyes travel farther
- Common shared dye between flavors visible at same Rf position
- Best separation often with mixed eluent (e.g., 70:30 isopropanol:water)
- Over-concentrated spots give tailing; let spots dry between applications
What do you think the graders are looking for? How would you score this?
Point Breakdown (25 pts total)
Must identify number and color of dyes in each sample (3 pts), whether shared dyes exist (2 pts), and rank dyes by polarity (2 pts).
Common Pitfalls
- Making spots too large or too wet on the paper
- Paper touching beaker walls during development
- Not running chromatography long enough for full separation
- Using pen (not pencil) for the origin line — ink will run with solvent
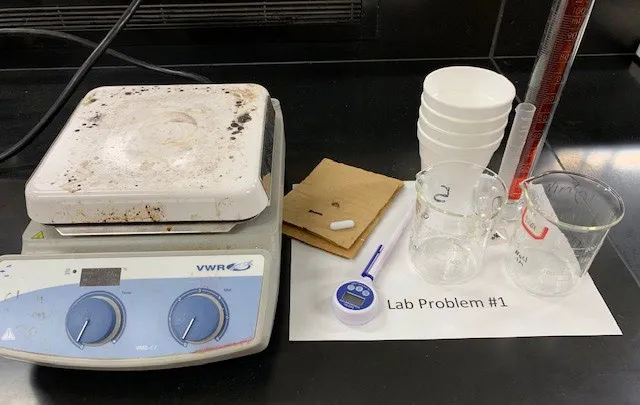
Question: Determine the enthalpy of decomposition of hydrogen peroxide using coffee cup calorimetry.
Write the H₂O₂ decomposition equation. Is it exo- or endothermic?
Key Chemistry: H2O2(aq) → H2O(l) + ½O2(g), catalyzed by Fe(NO3)3
Equipment
- Styrofoam cups (4) + cardboard lids with hole
- Thermometer
- 10 mL and 50 mL graduated cylinders
- Magnetic stirrer/hot plate, stir bar
- 150 or 250 mL beakers (2)
- Balance (±0.01 g)
Chemicals
- 3% H2O2 (150 mL)
- 0.5 M Fe(NO3)3 (30 mL)
Lab Setup
Given the equipment and chemicals, how would you design this experiment?
Method
- Calibrate calorimeter: Mix known amounts of warm and room-temp water; measure ΔT to determine Ccal
- Measure 50 mL H2O2; record Tinitial
- Add 10 mL of 0.5 M Fe(NO3)3; cap and stir
- Record Tfinal (maximum temperature)
- qtotal = qsolution + qcalorimeter
- Calculate moles H2O2 from 3% solution; ΔH = −qtotal/n
What measurements would you record? Design your data table first.
| Parameter | Calibration | Decomposition |
|---|---|---|
| Cold/RT water (mL) | 50.0 | 50.0 (H2O2) |
| Tinitial (°C) | 22.4 / 39.6 | 20.0 |
| Hot water / Fe(NO3)3 (mL) | 50.0 | 10.0 |
| Tfinal (°C) | 30.5 | 34.8 |
| Ccal (J/°C) | 25.8 | — |
| qtotal (J) | — | 4097 |
| Moles H2O2 | — | 0.04407 |
| ΔH (kJ/mol) | — | −93.0 |
Literature value: −94.6 kJ/mol. Molarity of 3% H2O2 ≈ 0.8813 M.
What would you expect to observe during this experiment?
- Addition of Fe(NO3)3 causes vigorous bubbling (O2 evolution)
- Solution color: pale yellow → dark amber → back to pale yellow (catalyst cycle)
- Temperature rises significantly (exothermic decomposition)
- Color change back to pale yellow confirms Fe3+ is a catalyst (regenerated)
- Higher Fe(NO3)3 concentration → faster reaction but same ΔH
- ~0.08 M Fe3+ gives excellent results
What do you think the graders are looking for? How would you score this?
Point Breakdown (25 pts total)
Expected Answer
| Value | Literature | Acceptable Range |
|---|---|---|
| ΔH decomposition | −94.6 kJ/mol | −92.7 to −96.5 kJ/mol |
Must also explain role of Fe(NO3)3 as catalyst with experimental evidence (color change cycle, rate increase).
Common Pitfalls
- Not accounting for the calorimeter heat capacity
- Adding catalyst too fast — reaction may be violent and cause splashing
- Not stirring during reaction — uneven temperature reading
- Temperature reading lag if using alcohol thermometer
Question: Rank the ability of different aqueous solutions to be absorbed by sodium polyacrylate polymer.
How does ionic strength affect polymer swelling? What role does charge play?
Solutions: 0.05 M NaCl, 0.05 M NH4Cl, 0.05 M MgCl2, 0.05 M glucose, distilled water
Equipment
- Watch glasses (4), test tubes (4)
- Beral pipets (4), spatula, stirring rod
- Balance (±0.01 g)
Chemicals
- Sodium polyacrylate powder (1 g)
- 0.05 M NaCl (25 mL)
- 0.05 M NH4Cl (25 mL)
- 0.05 M MgCl2 (25 mL)
- 0.05 M glucose (25 mL)
- Distilled water
Lab Setup
Given the equipment and chemicals, how would you design this experiment?
Method
- Place equal amounts of polymer (~spatula full or weighed) on separate watch glasses
- Add each solution dropwise until polymer no longer absorbs
- Count drops or measure volume absorbed for each solution
- Alternative: add known volume of solution, then add polymer until solidified
- Replicate trials for reliability
What measurements would you record? Design your data table first.
| Solution | Drops Absorbed | Mass Absorbed per g Polymer | Rank |
|---|---|---|---|
| Distilled water | 26–27 | ~410 g/g | Most absorbed |
| Glucose (0.05 M) | 30–32 | >310 g/g | 2nd |
| NaCl (0.05 M) | 8 | ~110 g/g | 3rd |
| NH4Cl (0.05 M) | 6–7 | ~110 g/g | 4th |
| MgCl2 (0.05 M) | 3–4 | ~50 g/g | Least absorbed |
What would you expect to observe during this experiment?
- Water: Maximum absorption — polymer swells dramatically into gel
- Glucose: Nearly as much absorption as water (non-ionic solute)
- NaCl / NH4Cl: Significantly less absorption — monovalent cations reduce osmotic swelling
- MgCl2: Least absorption — divalent Mg2+ cross-links carboxylate groups, collapsing polymer network
- Trend: Ionic solutions reduce swelling; higher charge density → more cross-linking → less absorption
- Polymer gel should not go down drain (clogs pipes)
What do you think the graders are looking for? How would you score this?
Point Breakdown (25 pts total)
Correct ranking: Mg2+ < NH4+ ≤ Na+ < glucose ≤ water. Must explain trend using osmotic pressure and cross-linking principles.
Common Pitfalls
- Not using equal masses of polymer for each solution test
- Not allowing enough time for full swelling equilibrium
- Confusing ionic strength (charge matters) with molarity (0.05 M for all)
- Not explaining WHY divalent ions reduce swelling more than monovalent
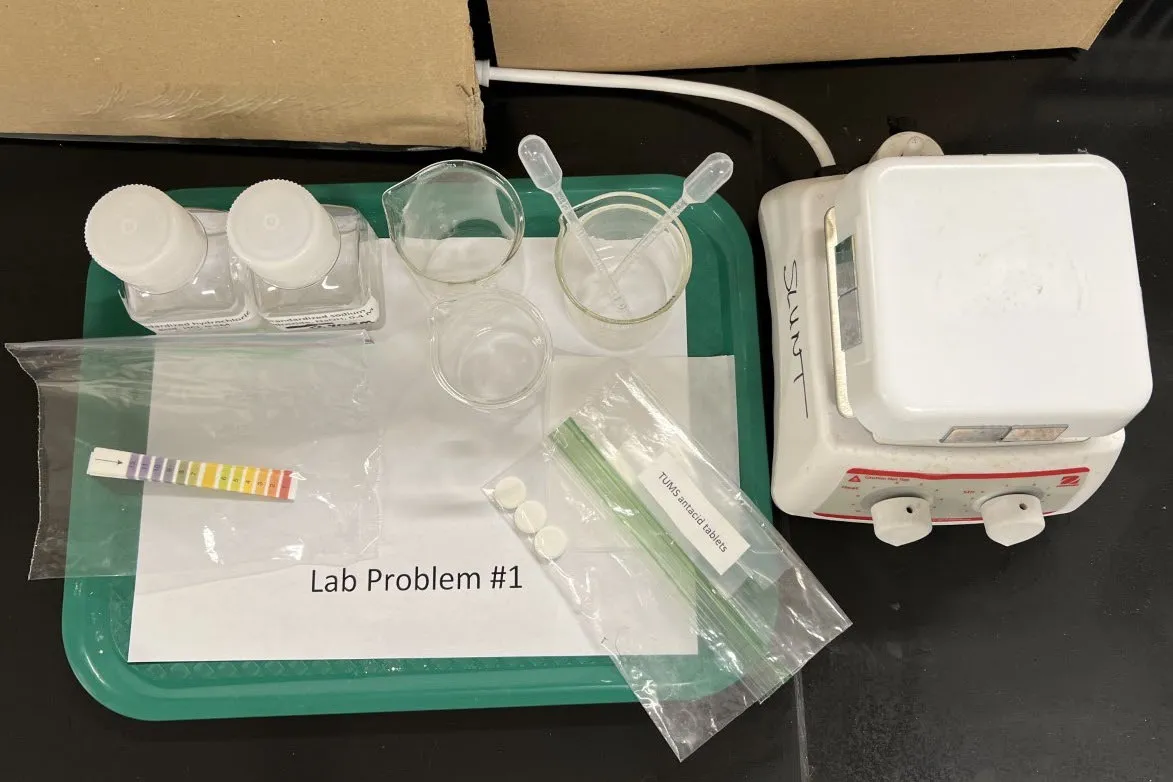
Question: Determine the moles of HCl (simulating stomach acid) that can be neutralized by a tablet of commercial antacid (TUMS).
Write CaCO₃ + 2HCl reaction. Why is back-titration needed instead of direct?
Key Chemistry: CaCO3 + 2HCl → CaCl2 + H2O + CO2
Equipment
- 25 mL graduated cylinder
- Graduated Beral pipets (0.25 mL graduations)
- 100–150 mL beakers (3)
- Hot plate (no stirring)
- pH indicator strips (range 1–12)
- Glass stirring rod, spatula, wax paper
Chemicals
- Standardized 0.5 M HCl (100 mL)
- Standardized 0.40–0.45 M NaOH (50 mL)
- Phenolphthalein indicator (0.5 mL)
- TUMS peppermint tablets (3, removed from packaging)
Lab Setup
Given the equipment and chemicals, how would you design this experiment?
Method (Back Titration)
- Crush tablet; dissolve in measured excess of standardized HCl
- Heat to near boiling to expel CO2; cool
- Check with pH paper that excess acid remains
- Add phenolphthalein; titrate with standardized NaOH to pink endpoint
- Moles HCl reacted = Total moles HCl − moles excess HCl (= moles NaOH at endpoint)
- Replicate trials
Alternative method: Mass loss — weigh before/after reaction to determine CO2 lost, then calculate moles CaCO3 and hence moles HCl.
What measurements would you record? Design your data table first.
Students should record:
| Parameter | Trial 1 | Trial 2 |
|---|---|---|
| Volume HCl used (mL) | — | — |
| Volume NaOH to endpoint (mL) | — | — |
| Drops → volume conversion | — | — |
| Color change observation | — | — |
Note: No balance was provided — students must work with volumes and concentrations only. Mass of tablet given as 1.3 g.
What would you expect to observe during this experiment?
- Tablet fizzes when added to HCl (CO2 evolution)
- Solution may appear white/cloudy due to tablet fillers
- Heating drives off dissolved CO2 — watch for bumping
- Phenolphthalein endpoint: colorless → persistent pale pink
- Fillers may burn if overheated on hot plate
- pH paper should confirm excess acid before titration
What do you think the graders are looking for? How would you score this?
Point Breakdown (25 pts total)
Accuracy Tiers (moles HCl per 1.3 g tablet)
| Range | Points |
|---|---|
| 0.00980 – 0.0106 mol | 7/7 (full) |
| 0.00882 – 0.00979 or 0.0107 – 0.0116 mol | 5/7 |
| 0.00784 – 0.00881 or 0.0117 – 0.0127 mol | 3/7 |
| Any other value | 0/7 |
Actual value: ~0.0100 mol. Answers in other units converted to moles before grading.
Common Pitfalls
- Not dissolving TUMS completely in HCl before back-titrating
- Heating too aggressively — bumping causes solution loss
- No balance provided — must rely on volumetric measurements only
- Not using enough excess HCl (all CaCO₃ must react first)
Question: Identify 6 unknown white powders using provided reagents.
Which reagent tests distinguish NaHCO₃, borax, cornstarch, epsom salts, sugar, and washing soda?
Unknowns: Baking soda (NaHCO3), Borax (Na2B4O7), Cornstarch, Epsom salts (MgSO4), Powdered sugar (sucrose + cornstarch), Washing soda (Na2CO3)
Reagents Provided
- Distilled water
- 10% HCl
- 10% NaOH
- 2% Iodine-KI solution
- Bromothymol blue indicator
- Phenolphthalein indicator
Equipment
- 12 test tubes + rack
- Well plate (6 or 12 wells)
- 4 Beral pipets
- Glass stirring rod, spatula
Lab Setup
Given the equipment and chemicals, how would you design this experiment?
Method
- Use equal small amounts of each unknown
- Test each with every reagent, add dropwise
- Observe: solubility, gas production, precipitate, color change
- Record systematically in a grid/flow chart
What measurements would you record? Design your data table first.
| Test \ Unknown | Cornstarch | NaHCO3 | MgSO4 | Pwdr Sugar | Na2CO3 | Borax |
|---|---|---|---|---|---|---|
| Water | Insoluble | Soluble | Soluble | Soluble | Soluble | Sparingly sol. |
| 10% HCl | Insoluble | Sol. + gas | Soluble | Soluble | Sol. + gas | Sol., no gas |
| 10% NaOH | No change | No change | White ppt | No change | No change | No change |
| Iodine | Dark blue-black | No change | No change | Faint blue-black | No change | No change |
| Phenolphthalein | No change | Pale pink | No change | No change | Dark pink | Pink |
| Bromothymol blue | Yellow-green | Blue | Yellow | Blue | Blue | Blue |
What would you expect to observe during this experiment?
Key Distinguishing Observations
- Cornstarch: Only insoluble powder + dark blue-black with iodine
- Powdered sugar: Soluble + faint blue-black with iodine (contains some cornstarch)
- NaHCO3 vs Na2CO3: Both gas with HCl, but Na2CO3 → dark pink with phenolphthalein, NaHCO3 → pale pink
- Epsom salts (MgSO4): Only powder forming white precipitate with NaOH: Mg(OH)2
- Borax: Soluble in acid but no gas; pink with phenolphthalein
What do you think the graders are looking for? How would you score this?
Point Breakdown (25 pts total)
Each correct identification with valid justification: 2 pts per unknown (6 unknowns = 12 pts).
Common Pitfalls
- Missing the iodine-starch test (turns purple/black) for cornstarch and powdered sugar
- Not testing pH of dissolved solutions — easy way to distinguish carbonates
- Cross-contaminating samples on well plate
- Not testing with HCl for fizzing (distinguishes carbonates from non-carbonates)
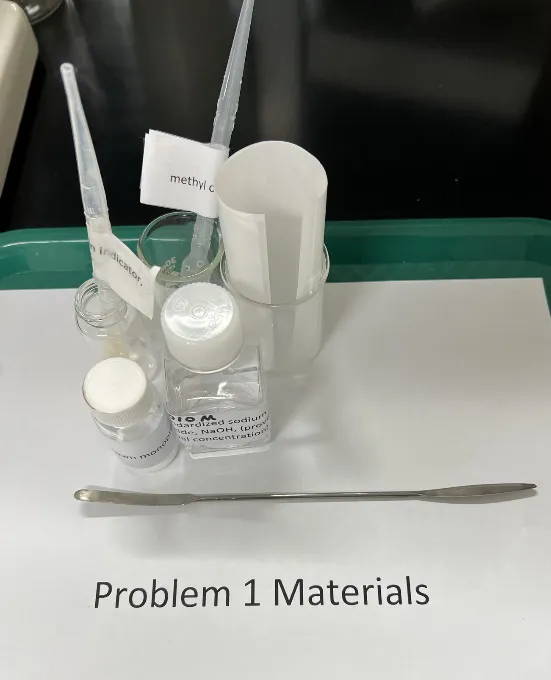
Question: Determine the molar mass and pKa of an unknown monoprotic weak acid.
How do you find both molar mass AND pKₐ from a single titration?
Unknown: Benzoic acid (C6H5COOH, MM = 122.12 g/mol, pKa = 4.2)
Equipment
- 10 mL graduated cylinder, Beral pipets (6)
- Balance (nearest 0.01 g)
- 50 or 100 mL beakers (6), stirring rods (3)
- Well plate, ruler, spatula, weigh paper
Chemicals
- Solid benzoic acid (labeled "unknown monoprotic acid"), 0.5 g
- Standardized 1 M NaOH (20 mL)
- Phenolphthalein indicator
- Methyl orange indicator
Lab Setup
Given the equipment and chemicals, how would you design this experiment?
Method
- Determine volume per drop of Beral pipet
- Weigh ~0.10 g of unknown acid; dissolve/suspend in water
- Add phenolphthalein; titrate with 1 M NaOH counting drops to pink endpoint
- Calculate: moles NaOH = moles acid (monoprotic) → molar mass = mass/moles
- For pKa: repeat with fresh acid sample, add exactly half the drops → pH at half-equivalence = pKa
- Use methyl orange color to estimate pH ~4
What measurements would you record? Design your data table first.
| Parameter | Trial 1 | Trial 2 | Trial 3 | Average |
|---|---|---|---|---|
| Drops NaOH to endpoint | 18 | 15 | 16 | 16.3 |
| Volume NaOH (L) | 0.00090 | 0.00075 | 0.00080 | 0.00082 |
| Moles NaOH | 0.00095 | 0.00080 | 0.00085 | 0.00087 |
| Mass acid (g) | 0.10 | 0.10 | 0.10 | 0.10 |
| Molar mass (g/mol) | 105 | 126 | 118 | 116 |
At half-equivalence (~8 drops): phenolphthalein colorless, methyl orange yellowish-orange → pKa ≈ 4
What would you expect to observe during this experiment?
- Benzoic acid is sparingly soluble in water; may see suspended particles
- Phenolphthalein endpoint: colorless → pink
- At half-equivalence: methyl orange shows yellowish-orange (transition range 3.1–4.4)
- Drop counting precision is critical — large drops cause overshoot
- Students may attempt to use both indicators simultaneously or sequentially
What do you think the graders are looking for? How would you score this?
Expected Answers
| Value | Actual | Acceptable Range |
|---|---|---|
| Molar Mass | 122.12 g/mol | ~105–130 g/mol (sample data) |
| pKa | 4.2 | ~3.5–4.5 (indicator-based estimate) |
Rubric emphasizes: drop calibration, replicate trials, clear calculations, correct identification of half-equivalence point concept.
Common Pitfalls
- Not finding the half-equivalence point (where pH = pKₐ)
- Incorrect molar mass calculation — must use moles NaOH at equivalence = moles acid
- Not weighing the acid sample accurately enough
- Choosing the wrong indicator for the specific pKₐ range
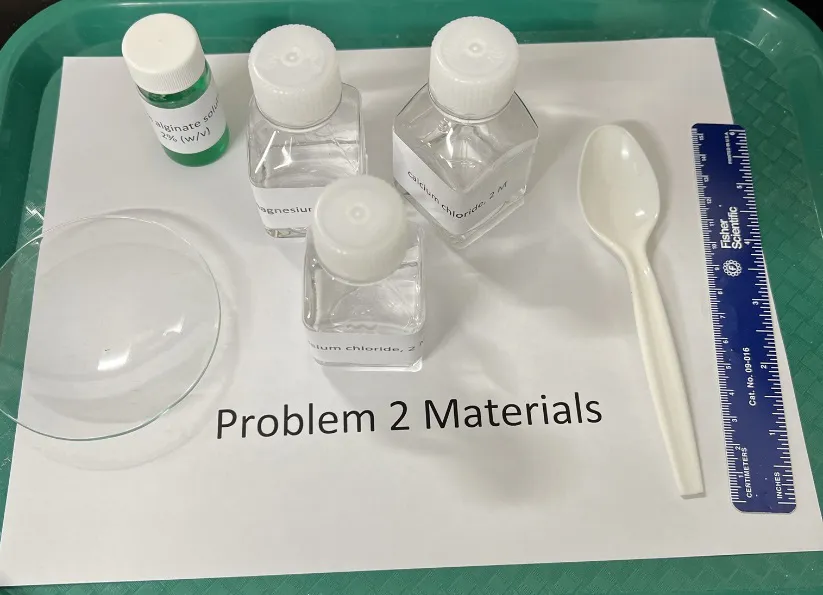
Question: Determine which cation (Ca2+, Mg2+, K+) produces the strongest cross-links in sodium alginate polymer to form hydrogel spheres.
Chemicals
- 2% sodium alginate solution (10 mL, colored with food dye)
- 2 M CaCl2 (30 mL)
- 2 M MgCl2 (30 mL)
- 2 M KCl (30 mL)
Lab Setup
Given the equipment and chemicals, how would you design this experiment?
Method
- Drop sodium alginate solution into each cation solution
- Compare sphere quality: firmness, shape retention, elasticity
- Best approach: create dilution series to find minimum concentration for spherification
- Can also dilute alginate and test minimum concentration
What measurements would you record? Design your data table first.
| Cation | Sphere Formation | Minimum Conc. for Spheres |
|---|---|---|
| Ca2+ | Well-formed, elastic spheres | ~0.04–0.1 M |
| Mg2+ | Sheets/films only, no spheres | N/A |
| K+ | No spheres at any concentration | N/A |
What would you expect to observe during this experiment?
- Ca2+: Strong, elastic spheres at 0.1 M+; softer at 0.04–0.09 M; none below 0.04 M
- Mg2+: No discrete spheres — forms sheets or films instead
- K+: No cross-linking observed at any concentration
- Explanation: Ca2+ (divalent, appropriate ionic radius) bridges carboxylate groups on adjacent alginate chains effectively. Mg2+ is divalent but too small for effective "egg-box" coordination. K+ is monovalent and cannot bridge chains.
What do you think the graders are looking for? How would you score this?
Assessment Areas
- Plan: Systematic approach, dilution series concept
- Data: Clear observations for each cation, concentration effects
- Answer: Ca2+ produces strongest cross-links
- Explanation: Relates ionic charge and size to cross-linking ability; mentions "egg-box" model or carboxylate bridging
Common Pitfalls
- Only testing undiluted cation solutions — dilution series gives much better data
- Not quantifying sphere quality consistently across cations
- Not explaining the "egg-box" model or why charge density matters
- Forgetting to note that Mg²⁺ forms sheets/films, not spheres
Question: Determine the enthalpy of (heat of) solution, in kJ/mol, for three unknown solids.
Which of urea, Na₂CO₃, and NaOAc dissolutions are endothermic vs exothermic?
Unknowns: Urea (+13.9 kJ/mol), Na2CO3 (−26.7 kJ/mol), NaOAc (−17.3 kJ/mol)
Equipment
- Thermometer (alcohol or digital)
- Graduated cylinder (25 mL+)
- Styrofoam cup calorimeter with cap
- 250 mL+ beaker, stirring rod
- Balance (milligram precision)
Given the equipment and chemicals, how would you design this experiment?
Method
- Measure and weigh water (~25 mL) in calorimeter cup
- Record initial temperature
- Weigh ~2 g of unknown solid
- Add solid to water; stir; cap
- Record maximum/minimum temperature
- Calculate: qwater = mcΔT; qdissolution = −qwater
- Convert to kJ/mol using mass and molar mass
- Replicate trials for each unknown
What measurements would you record? Design your data table first.
| Parameter | Unk 1 T1 | Unk 1 T2 | Unk 2 T1 | Unk 2 T2 | Unk 3 T1 | Unk 3 T2 |
|---|---|---|---|---|---|---|
| Mass water (g) | 25.15 | 25.85 | 27.59 | 26.42 | 22.67 | 24.62 |
| Ti (°C) | 22.4 | 22.3 | 22.5 | 22.4 | 22.2 | 22.3 |
| Mass solid (g) | 2.06 | 2.15 | 2.18 | 2.20 | 2.26 | 2.05 |
| Tf (°C) | 17.3 | 17.2 | 27.6 | 27.8 | 27.0 | 26.9 |
What would you expect to observe during this experiment?
- Unknown 1 (Urea): Temperature decreases — endothermic dissolution
- Unknown 2 (Na2CO3): Temperature increases — exothermic dissolution
- Unknown 3 (NaOAc): Temperature increases — exothermic dissolution
- Cup should be capped to minimize heat loss
- Stirring ensures uniform dissolution and temperature reading
What do you think the graders are looking for? How would you score this?
Expected Answers
| Unknown | Identity | ΔHsol (kJ/mol) | Sample Calc (kJ/mol) |
|---|---|---|---|
| 1 | Urea | +13.9 | +15.6 |
| 2 | Na2CO3 | −26.7 | −28.6 |
| 3 | NaOAc | −17.3 | −16.5 |
Rubric emphasizes: proper calorimetry setup, correct sign convention (endo vs exo), replicate measurements, clear q = mcΔT calculations.
Common Pitfalls
- Not capping the Styrofoam cup calorimeter — heat escapes
- Wrong sign convention: q_dissolution = −q_water
- Not using enough water to fully dissolve the solid
- Forgetting replicate trials for each unknown
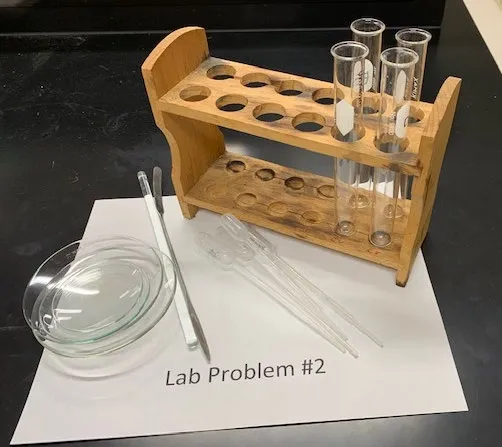
Question: Identify 5 unknown liquids using capillary tube behavior.
Rank water, salt water, vegetable oil, isopropanol, and acetone by surface tension.
Unknowns: Water, 10% salt water, vegetable oil, isopropanol, acetone
Equipment
- 5 open-ended glass capillary tubes
- Ruler with mm markings
- 5 unknown liquid samples (~1 mL each)
Given the equipment and chemicals, how would you design this experiment?
Method
- Dip capillary tube vertically into each liquid
- Measure the height of capillary rise (mm)
- Higher surface tension + lower density → greater capillary rise
- Compare results to known surface tension values
- Also observe: meniscus shape, viscosity, evaporation rate
What measurements would you record? Design your data table first.
| Liquid | Surface Tension (mN/m) | Expected Rise Order | Other Clues |
|---|---|---|---|
| Water | 72.8 | Highest | Concave meniscus |
| 10% Salt water | ~74 | Very high (close to water) | Slightly higher tension than pure water |
| Isopropanol | 23.0 | Moderate | Alcohol smell, fast evaporation |
| Acetone | 25.2 | Moderate | Strong smell, very fast evaporation |
| Vegetable oil | ~32 | Low (high viscosity offsets) | Viscous, slow rise, no evaporation |
Note: Capillary rise depends on surface tension, density, and contact angle. Oil has moderate surface tension but high viscosity slows the rise.
What would you expect to observe during this experiment?
- Water vs salt water: Very similar rise heights — distinguish by slight density/tension difference or taste is not allowed; students may struggle here
- Isopropanol vs acetone: Similar surface tensions; acetone evaporates faster and has distinct smell
- Vegetable oil: Visibly viscous, slow rise, no evaporation, distinctive appearance
- Additional observations: meniscus curvature (concave for hydrophilic liquids), evaporation speed, viscosity
What do you think the graders are looking for? How would you score this?
Assessment Areas
- Plan: Systematic capillary rise measurement, controlled procedure
- Data: Measured heights (mm) for all unknowns, multiple trials
- Calculations: Ranking by surface tension, relating to IMF
- Identification: Correct ID with justification from capillary data + supplementary observations
Common Pitfalls
- Not holding capillary tube perfectly vertical
- Reading height from wrong point on the meniscus
- Not using supplementary observations: smell, viscosity, evaporation rate
- Difficulty distinguishing water from salt water — very similar capillary rise
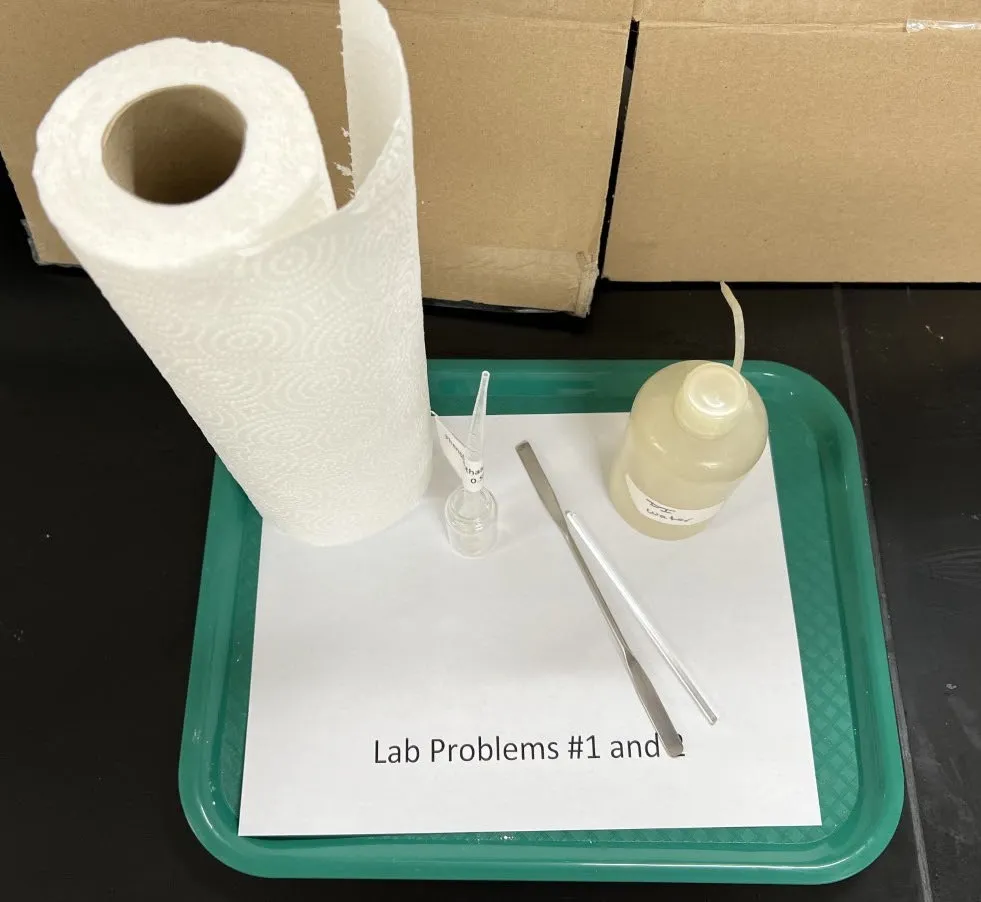
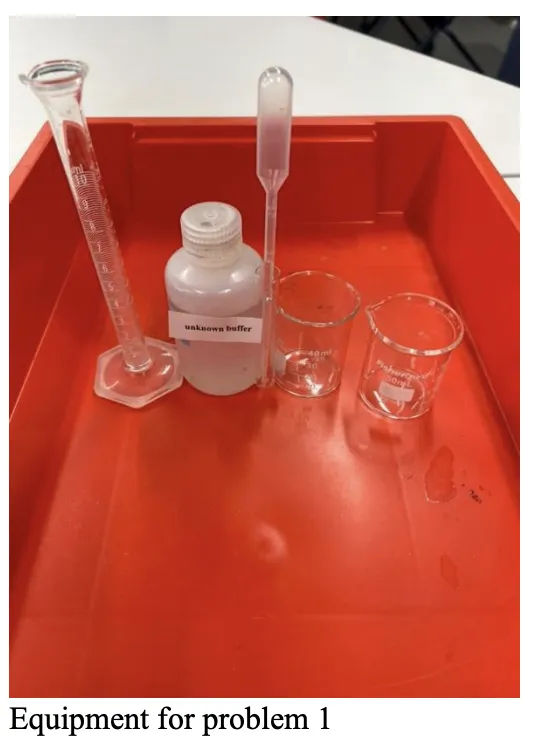
Question: Determine the buffer capacity, concentrations of conjugate acid and base, and Ka of the conjugate acid for an unknown buffer solution.
Write the Henderson-Hasselbalch equation. How do you find Kₐ from a buffer titration?
Buffer: pH ≈ 9, Ka ≈ 6 × 10⁻¹⁰
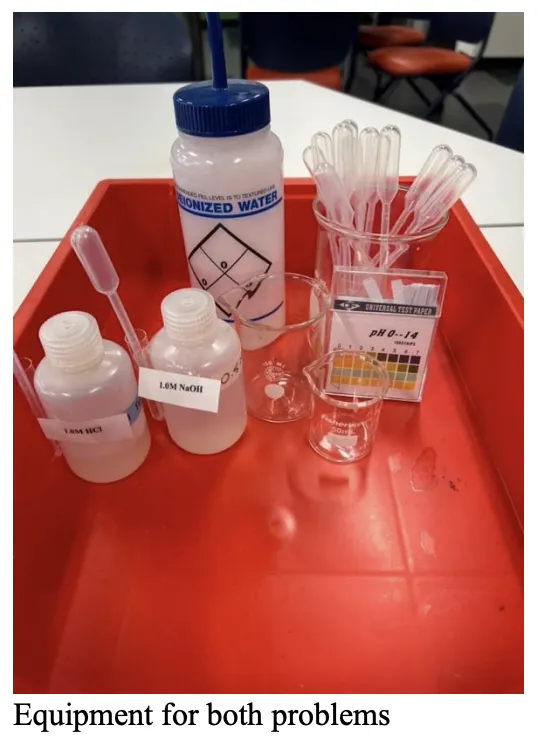
Equipment
- Graduated Beral pipets
- pH paper (range 0–14)
- Beakers, stirring rods, wash bottle
- Graduated cylinder (10 mL)
Chemicals
- Unknown buffer solution
- 1.0 M HCl
- 1.0 M NaOH
Lab Setup Photos
Given the equipment and chemicals, how would you design this experiment?
Method
- Calibrate drop volume (drops per mL)
- Measure 10 mL of buffer; record initial pH
- Titrate with 1.0 M NaOH, one drop at a time, recording pH after each drop
- Repeat with fresh buffer + 1.0 M HCl
- Plot pH vs drops; identify equivalence points and buffer region
- Calculate buffer capacity, [HA], [A−], and Ka
Graph Paper Grid
The actual exam provides 6 blank grids (2 × 3 layout) as follows:
What measurements would you record? Design your data table first.
| Drops NaOH | pH |
|---|---|
| 0 | 9 |
| 1–6 | 9 → 9 |
| 7 | 9.5 |
| 8 | 10 |
| 9 | 11 |
| 10–13 | 11.5 → 12 |
| Drops HCl | pH |
|---|---|
| 0 | 9 |
| 1–3 | 9 → 9 |
| 4 | 8 |
| 5 | 6.5 |
| 6 | 4 |
| 7–9 | 3 → 3 |
Equivalence: ~8.5 drops NaOH (neutralizes HA), ~5 drops HCl (neutralizes A−)
What would you expect to observe during this experiment?
- Buffer resists pH change for first several drops of both acid and base
- Sharp pH jump at equivalence point — dramatic color change on pH paper
- NaOH titration: 6–7 drops in buffering region before jump
- HCl titration: 4–5 drops in buffering region before jump
- Buffer capacity asymmetric: more HA than A−
What do you think the graders are looking for? How would you score this?
Point Breakdown (25 pts total)
Section 4 (final answers) points are included within each calculation section above.
1. Experimental Plan (5 pts)
Procedure should include:
- Method for determining volume of a drop (can be omitted if memorized)
- Volume of buffer to use — best to use a smaller volume (10 mL) and titrate dropwise with 1.0 M HCl or NaOH
- May do a survey trial to find approximate volume of acid/base that destroys the buffer
- Add a drop of designated reagent with stirring; determine pH after each drop
- Continue until pH stabilizes at higher or lower value
- If reusing same buffer: after one titration, add equivalent volume of complementary solution to return to starting pH
- Repeat for complementary titrant (NaOH if HCl was used first, and vice versa)
- Repeat for multiple trials
2. Data/Observations (5 pts)
Data should include:
- Volume (mL) of buffer used in each titration
- Data table: number of drops of titrant (NaOH or HCl) with corresponding pH
- Note: students may use volume markings on graduated pipets — this is less precise than counting drops and should not receive as much credit
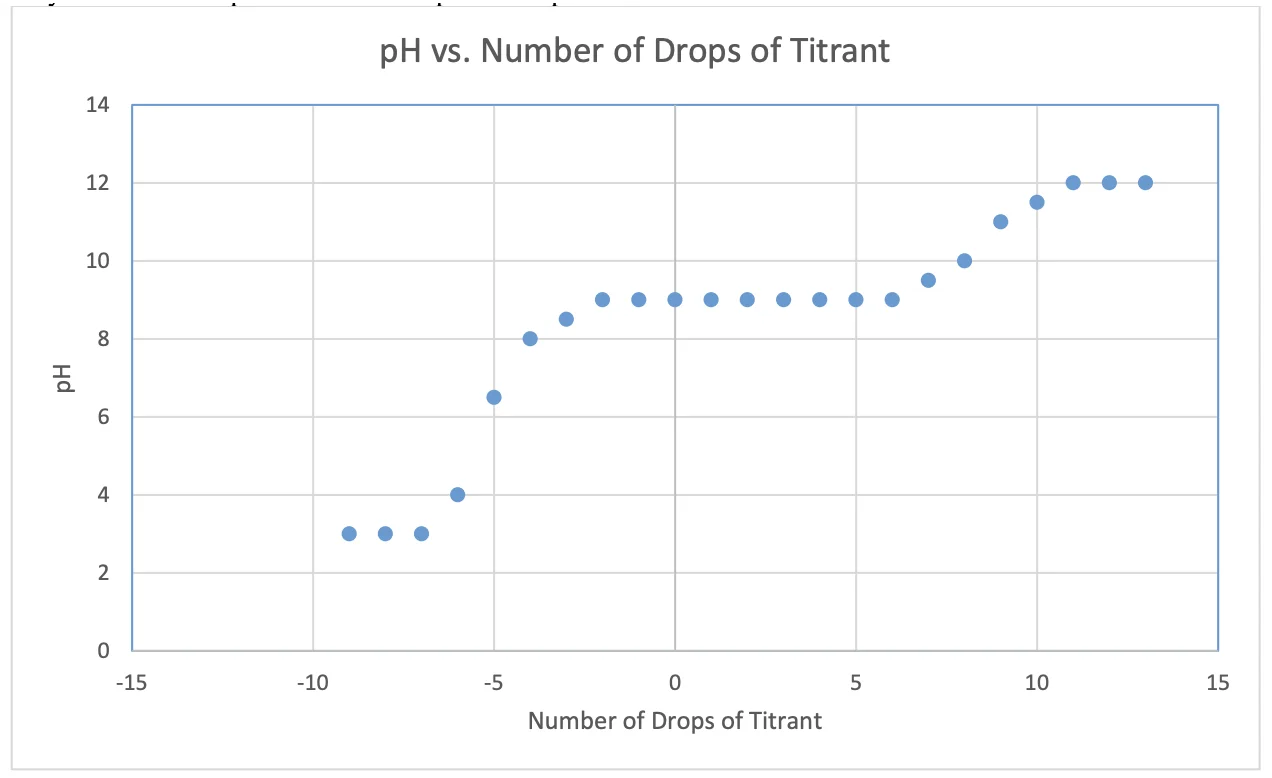
Plots will vary but should resemble the graph below. Multiple plots for multiple trials. Students may have marked equivalence and ½ equivalence points.
Expected pH vs. Drops of Titrant
3a) Buffer Capacity (5 pts)
- Buffer capacity = (mol/L of buffer) ÷ ΔpH in the buffering region (before dramatic pH change)
- ~4–10 drops of acid/base added in the buffering region (pH ~8.0 to ~10.0)
- 10 drops × 0.05 mL/drop × (1 L/1000 mL) × 1.00 mol/L = 0.0005 mol → 0.05 mol/L
- ΔpH in buffer region from pKₐ on graph: 8 → 10 = ΔpH = 1.0
- Buffer capacity ≈ 0.05 / 1.0 = ~0.050
3b) Concentrations of Conjugate Acid and Base (5 pts)
- NaOH equivalence point at ~8.5 drops of base added to buffer
- 8.5 drops × 0.05 mL/drop × (1 L/1000 mL) × 1.00 mol/L = 0.0004 mol NaOH = mol HA neutralized
- [HA] = 0.0004 / 0.0100 L = 0.040 mol/L
- HCl equivalence point at ~5 drops of acid added to buffer
- 5 drops × 0.05 mL/drop × (1 L/1000 mL) × 1.00 mol/L = 0.00025 mol HCl = mol A⁻ neutralized
- [A⁻] = 0.00025 / 0.0100 L = 0.025 mol/L
3c) Ka of the Conjugate Acid (5 pts)
Method 1 — Henderson-Hasselbalch:
- Initial pH = 9, [A⁻] = 0.025 M, [HA] = 0.040 M
- 9 = −log Ka + log(0.025/0.040)
- Ka ≈ 6 × 10⁻¹⁰
Method 2 — Direct calculation:
- [H⁺] = 10−9 = 1 × 10⁻⁹
- Ka = [H⁺][A⁻]/[HA] = (1 × 10⁻⁹)(0.025)/(0.040)
- Ka ≈ 6 × 10⁻¹⁰
Note: sig figs rules largely ignored — focus is on the process each student uses.
Expected Final Answers
| Quantity | Expected Value |
|---|---|
| Buffer capacity | ~0.050 (range pH 8–10) |
| [HA] | ~0.040 M |
| [A−] | ~0.025 M |
| Ka | ~6 × 10⁻¹⁰ |
Sample calculations may differ for sections as there may be variance in prepared buffers.
Common Pitfalls
- Not calibrating drop volume (drops/mL) before starting titration
- Using volume markings on pipets instead of counting drops (less precise)
- Not using fresh buffer aliquot for each titration direction (acid and base)
- Using too large a buffer volume — larger volumes take too many drops and too long
- Missing that pH at half-equivalence = pKa
- Confusing which equivalence point corresponds to [HA] vs [A⁻] (NaOH neutralizes HA; HCl neutralizes A⁻)
- Not stirring after each drop addition
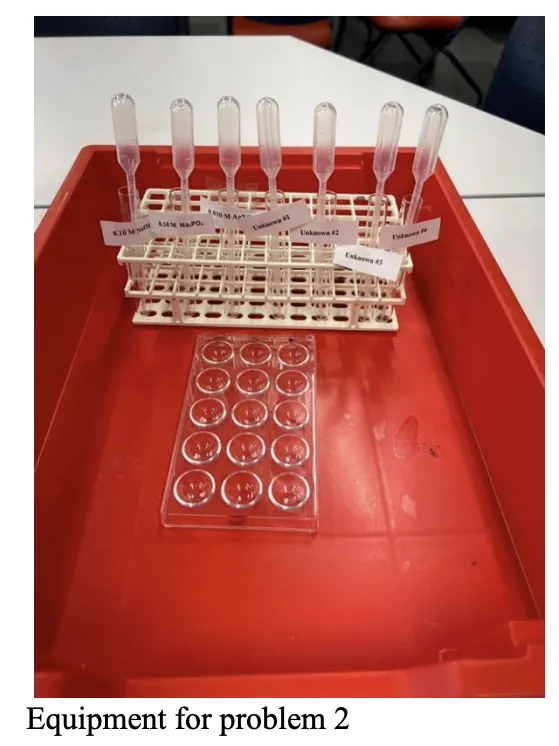
Question: Identify 4 unknown salt solutions using provided reagents. Each cation and anion used only once.
What reagents distinguish Na⁺, Ca²⁺, Mg²⁺, and NH₄⁺? What about OAc⁻, CO₃²⁻, Cl⁻, NO₃⁻?
Unknowns: MgCl2, Ca(OAc)2, NH4NO3, Na2CO3
Ion pool: Na+, Ca2+, Mg2+, NH4+ | OAc−, CO32−, Cl−, NO3−
Reagents Provided
- 0.01 M AgNO3
- 1.0 M HCl
- 0.1 M NaOH
- 1.0 M NaOH
- 0.1 M Na3PO4
- pH strips
Lab Setup Photos
Given the equipment and chemicals, how would you design this experiment?
Method
- Test pH of each unknown
- Test each unknown with each reagent in a spot plate
- Record: precipitates, gas evolution, smell
- Use process of elimination for cations and anions
What measurements would you record? Design your data table first.
| Test \ Unknown | MgCl2 | Ca(OAc)2 | NH4NO3 | Na2CO3 |
|---|---|---|---|---|
| pH | 6–7 | 6 | 4–5 | 11 |
| AgNO3 | ppt | No rxn (faint) | No rxn | ppt |
| 1.0 M HCl | No rxn | No rxn (vinegar smell) | No rxn | Bubbles! |
| 0.1 M NaOH | ppt | No/faint ppt | No rxn | No rxn |
| 1.0 M NaOH | ppt | ppt | NH3 smell | No rxn |
| Na3PO4 | ppt | ppt | No rxn | No rxn |
What would you expect to observe during this experiment?
Key Distinguishing Observations
- Na2CO3: pH 11 (basic anion) + bubbles with HCl → unique CO32− identifier
- NH4NO3: pH 4–5 (acidic cation) + ammonia smell with 1.0 M NaOH + no precipitates
- MgCl2: ppt with 0.1 M NaOH (Mg(OH)2) + ppt with AgNO3 (AgCl)
- Ca(OAc)2: No ppt with 0.1 M NaOH but ppt with 1.0 M NaOH; vinegar smell with HCl; AgOAc slightly soluble (faint/no ppt)
- Distinguishing Mg2+ from Ca2+: 0.1 M NaOH precipitates Mg(OH)2 but Ca(OH)2 is "soluble" enough to stay dissolved at 0.1 M
What do you think the graders are looking for? How would you score this?
Point Breakdown (25 pts total)
Must note reagent concentrations in data table (−1 if omitted). Each correct salt + valid justification: 2.5 pts (4 unknowns = 10 pts).
Common Pitfalls
- Not testing pH first — easy way to narrow down (Na₂CO₃ is basic)
- Missing the ammonia smell test: warm NH₄NO₃ + NaOH releases NH₃ gas
- Not using process of elimination (each ion appears only once)
- Forgetting AgNO₃ test for Cl⁻ (white AgCl precipitate)
Year-by-Year Comparison
| Year | Type | Topic | Core Technique | Unknowns | Balance? | Key Skill |
|---|---|---|---|---|---|---|
| 2015 | QUANT | H2O2 concentration | Catalytic decomposition / mass loss | 0 | Yes | Gravimetric analysis, stoichiometry |
| 2015 | QUAL | Cu2+ equilibrium | Le Chatelier observation | 2 | No | Equilibrium, color observation, thermodynamics |
| 2016 | QUANT | Iodine clock kinetics | Method of initial rates | 0 | No | Kinetics, rate law, timing |
| 2016 | QUAL | Acid proticity | Titration + universal indicator | 1 | No | Acid-base, indicator color mapping |
| 2017 | QUANT | Alka-Seltzer composition | CO2 mass loss | 0 | Yes | Stoichiometry, limiting reagent |
| 2017 | QUAL | Solution ID (5 unknowns) | Systematic mixing | 5 | No | Precipitation, gas evolution, solubility rules |
| 2018 | QUANT | Ca2+/Mg2+ in milk | EDTA titration | 0 | No | Complexometric titration, indicator |
| 2018 | QUAL | Kool-Aid dye separation | Paper chromatography | 2 flavors | No | Chromatography, Rf, polarity |
| 2019 | QUANT | H2O2 ΔH decomposition | Calorimetry | 0 | Yes | q=mcΔT, catalyst, calorimeter constant |
| 2019 | QUAL | Polymer absorption ranking | Superabsorbent swelling | 5 solutions | Yes | Polymer chemistry, osmotic pressure, ionic effects |
| 2022 | QUANT | Antacid neutralization | Back titration | 0 | No | Titration, stoichiometry |
| 2022 | QUAL | White powder ID | Reagent testing | 6 | No | Chemical observations, systematic testing |
| 2023 | QUANT | Weak acid analysis | Direct titration | 1 | Yes | Titration, molar mass, pKa |
| 2023 | QUAL | Polymer cross-linking | Spherification | 3 cations | No | Observation, dilution series, reasoning |
| 2024 | QUANT | Enthalpy of solution | Calorimetry | 3 | Yes | q=mcΔT, sign convention |
| 2024 | QUAL | Liquid ID | Capillary action | 5 | No | IMF, surface tension, physical observation |
| 2025 | QUANT | Buffer analysis | Dropwise titration | 0 | No | Buffer chemistry, Henderson-Hasselbalch |
| 2025 | QUAL | Salt solution ID | Reagent testing | 4 | No | Precipitation, solubility rules, elimination |
Trends & Statistics
Quantitative Labs by Year
Qualitative Labs by Year
Skills Frequency Across All Labs
Average Rubric Weight Distribution
Loading charts...
Coaching Recommendations
Priority Practice #1: Titration Mastery
- Practice with Beral pipets (not burets!) — calibrate drop volume every time
- Back titration, direct titration, and buffer titration are all fair game
- Know phenolphthalein, methyl orange, bromothymol blue endpoints cold
- Practice reaching endpoints within 15–20 drops for accuracy
- Always do at least 2 replicate trials
Priority Practice #2: Qualitative Analysis
- Build a mental flowchart for common ions: Ag+, Cl−, CO32−, SO42−, NH4+
- Practice reagent-by-reagent grid testing on spot plates
- Know solubility rules: which hydroxides, carbonates, sulfates, chlorides are insoluble
- Smell tests: acetic acid (vinegar), ammonia — use wafting technique
- Iodine-starch test, flame tests, precipitation reactions
Priority Practice #3: Calorimetry
- Styrofoam cup calorimetry — proper technique for temperature measurement
- q = mcΔT — know sign conventions (endo vs exo) cold
- Practice dissolving solids and reading thermometers quickly
- Appeared in 2024 — may cycle back after titration-heavy run
Priority Practice #4: Data Presentation
- Always create organized data tables — this is heavily graded
- Label all columns with units
- Show replicate trials
- For qualitative: use grid format (unknown × reagent)
- Write clear, concise justifications — no rambling
Strategy: Time Management (90 min total)
- Read both problems first (~3 min)
- Start with whichever problem you're more confident about
- Qualitative labs can be faster — do them first if you're quick
- Budget ~40 min per problem + 10 min buffer
- Get safety approval early — raise hand immediately after writing plan
Predicted Future Topics
- Quantitative: Colorimetry/Beer's law (without spectrophotometer), redox titration (permanganate) — kinetics (2016) and gravimetric (2015, 2017) have appeared but not recently
- Qualitative: Redox reactions, coordination chemistry colors — chromatography (2018) and polymer chemistry (2019, 2023) may cycle back
Resources
Want structured USNCO preparation?
Recording packets available now — start anytime with 1-year access. Live classes resume July 2026.
A free resource from Dr. Chen's Academy